The Network Operations Center (NOC) is critical in detecting, isolating, and resolving network, application, and cloud infrastructure faults that inevitably occur due to operational realities and can potentially result in expensive downtime.
As IT infrastructures continue to evolve, the NOC must keep up with a robust toolset to handle new and old technologies and changing operational requirements.
In addition to the tools that have been a mainstay of the NOC for years, IT organizations are looking at a new breed of technologies that bring machine learning and automation into the NOC to better handle workloads and re-focus staff on revenue-generating projects rather than reactive support tasks.
But choosing the right tools for a NOC isn’t easy, especially for enterprises, communications service providers, and OEMs with large network environments. The price tags are high, the stakes are high, blindspots are everywhere, and the list of questions can seem endless.
- “What functionality is operationally important to us?”
- “How do the features of this tool map to the support operation workflows we want?”
- “Do we have everything we need to operationalize this tool?”
- “Will this tool continue to work the way we want it to as we expand service?”
- “Does this tool offer upgrade options to make the solution ‘future-proof’?”
- “Is the pricing for this tool transparent? And do the licensing models fit our organization's requirements?”
- “Will this tool integrate with other tools? And do we know how to set up that integration correctly?”
- “How much time do we need to invest before we see a benefit?”
The list goes on.
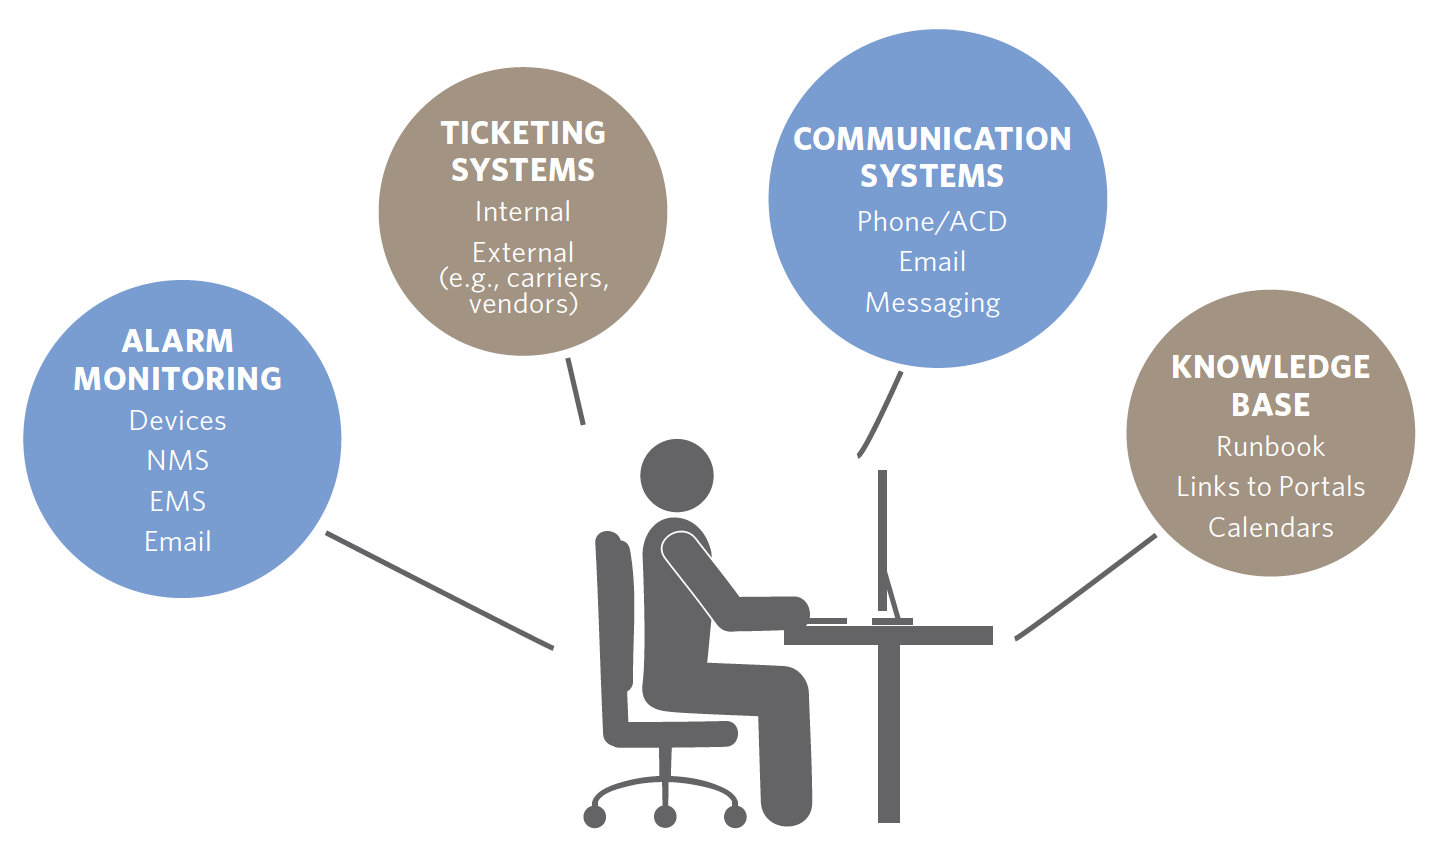 Here, we briefly examine some of the NOC tools hard at work inside some of the most complex and multi-faceted IT organizations. This is certainly not an exhaustive list; rather, a quick look into the categories of tools one would likely find hard at work inside any high-performing NOC.
Need expert assistance figuring out which NOC tools are best for you or how to better utilize, configure, integrate, or operationalize your tools to improve service? Schedule a NOC consultation with our Solution Engineering Team and start the conversation.
1. Network Monitoring and Observability Platforms
An NMS constantly monitors elements and services across the network, IT, and cloud infrastructure. It also conducts analyses and notifies the appropriate personnel when an issue arises or when critical values have been exceeded. With the right NMS, the correct and actionable events, trends, and metrics are available to trigger the appropriate personnel’s response.
Of course, every organization has different requirements for a network monitoring solution. There are many different tools and solutions on the market, so careful consideration is key.
SolarWinds

SolarWinds is often the go-to network monitoring and management system for many organizations, primarily because of its robust on-premise capabilities. It uses standard protocols such as SNMP and WMI to check on infrastructure element statuses, and its autodiscovery feature is a significant advantage, allowing for the automatic compilation of an asset inventory and a network topology map.
However, SolarWinds is more frequently a client-provided tool rather than one preferred or recommended by INOC. We tend to favor LogicMonitor for its solutions due to its broader capabilities and cloud-native flexibility. Integrating SolarWinds with other tools and platforms can sometimes be challenging. This is a significant factor for enterprises that rely on a diverse set of IT management tools. LogicMonitor, on the other hand, offers smoother integration capabilities, making it easier to create a unified monitoring ecosystem.
One of SolarWinds' strengths is its ability to keep data within the organization’s control, ensuring no leakage to external sources if access is properly managed. Yet, there are notable downsides. The cost of running SolarWinds can be substantial. It demands significant hardware resources, adding to the high price tag of purchasing and licensing the system. Beyond these costs, managing the additional on-premise or virtual assets necessary for efficient operation further increases expenses.
Furthermore, setting up and optimizing SolarWinds is complex and often requires specialized consulting services. This setup process can be an extensive and costly endeavor, particularly for enterprises with large-scale IT and cloud infrastructures. When choosing SolarWinds, Organizations must consider these upfront costs carefully and weigh them against the potential benefits.
LogicMonitor

LogicMonitor is a powerful cloud-based monitoring platform that stands out for its cloud-native capabilities and ability to seamlessly monitor full-stack environments across both on-premise and cloud-based resources, from layer one to layer seven. This flexibility makes it ideal for organizations with diverse and evolving IT infrastructures; it accommodates the needs of both small businesses and large enterprises, with its cloud-native design ensuring scalability without significant infrastructure changes. It offers deep visibility into all aspects of IT environments, from physical hardware to application performance. This ensures that all components of the IT stack are effectively monitored.
One of LogicMonitor's key differentiators is its use of "collectors." These are small applications that run on server hardware, connect to assets, and communicate back to the cloud over TLS—a secure and reliable communication method. This approach centralizes monitoring to a few points in your network, reducing the complexity and overhead typically associated with on-premise systems. Furthermore, the cloud and internet resources that collect your data don't have access, enhancing security by controlling the data within the organization.
LogicMonitor’s cloud-native architecture means that it natively supports monitoring for a wide range of environments. It can handle everything from traditional on-premise infrastructure to modern cloud deployments, including popular platforms like Azure, AWS, and Google Cloud. This makes it an attractive option for organizations undergoing digital transformation, as it provides a unified monitoring solution without the need for additional infrastructure.
We find the platform integrates pretty seamlessly with various IT management tools, creating a cohesive monitoring ecosystem that enhances operational efficiency. Robust performance management features allow monitoring and analyzing key performance indicators (KPIs), helping identify trends, diagnose issues, and optimize resource utilization.
While LogicMonitor shares some initial configuration challenges with other platforms, its cloud-native design offloads much of the optimization work to the vendor, which is covered by the monthly subscription fee. This subscription model can be cost-effective, especially when considering the reduced need for on-premise infrastructure and the associated management costs.
However, organizations should be mindful of the per-element pricing model. As the number of monitored elements grows, so do the costs. Careful evaluation of the pricing structure in relation to the capabilities and benefits provided by LogicMonitor is essential to ensure it aligns with the organization's budget and monitoring needs.
In short, we find that LogicMonitor’s cloud-native capabilities, full-stack monitoring, and ease of integration make it a great solution for many organizations. Its ability to provide comprehensive visibility across both on-premise and cloud environments positions it as a versatile and robust tool for modern IT operations.
OpenNMS
OpenNMS is the open-source solution on our list. Like many open-source tools, the big advantage here is not having to pay upfront for licensing. Depending on your internal capabilities and the complexity of your environment, you may incur some consulting fees for implementation and setup, but the product itself is free.
In terms of capability, OpenNMS can do pretty much anything that your organization could do with SolarWinds or LogicMonitor. The downside is that while it does do quite a bit “out of the box,” enterprises and other large organizations should expect to do much more work to configure the tool to bring those capabilities to life. It’s an even heavier lift than SolarWinds and LogicMonitor to get up and running right.
OpenNMS can be run as a standalone system with the central OpenNMS server doing the network and infrastructure monitoring, or it can be run with what it calls “minions.” These are similar to LogicMonitor’s “collectors,” which run on a server with connectivity and SSL back to your OpenNMS box, wherever it lives.
This option offers a lot of flexibility in designing and operationalizing your monitoring architecture. For example, you can easily place minions on your local on-premise locations and securely send data back to your OpenNMS server. At the same time, your organization can have its OpenNMS server live inside its cloud compute environment. In this scenario, your team can utilize that host to monitor its cloud and compute assets directly.
The point here is that OpenNMS is highly flexible—more so than the other tools we’ve mentioned—as it gives your organization much more control over how you want your monitoring set up and run. Again, however, that flexibility comes with the cost of heavy configuration.
Dynatrace

Dynatrace is a specialized observability tool focused on application and compute monitoring. It is particularly valuable in environments that rely heavily on HTTP and HTTPS applications. It provides deep visibility into application performance and offers robust observability capabilities that allow organizations to understand their applications' architecture and behavior.
Dynatrace excels in application monitoring, offering detailed insights into how applications interact with various elements within the IT environment. This includes automatic discovery and mapping of application dependencies, which helps understand the flow and impact of application transactions across different servers and services.
Like LogicMonitor, Dynatrace offers full-stack monitoring capabilities covering everything from the infrastructure to the application layer. This ensures comprehensive visibility into the entire IT stack, making identifying and resolving performance issues easier. Dynatrace also leverages artificial intelligence to provide intelligent insights and automated root cause analysis. This helps quickly identify and address performance bottlenecks, reducing the time to resolution and enhancing overall application performance.
It integrates with popular cloud platforms like AWS, Azure, and Google Cloud, making it an ideal solution for organizations with hybrid or multi-cloud environments. Its cloud-native design ensures that it can effectively monitor both on-premise and cloud-based resources. We find that Dynatrace is particularly popular among application developers and DevOps teams thanks to its ability to provide detailed insights into application performance and behavior. This makes it a preferred choice for organizations monitoring complex application environments.
One of Dynatrace's standout features is its ability to automatically discover and map application dependencies. This simplifies the process of understanding how applications interact with various components within the IT environment, enabling more effective troubleshooting and optimization.
From a NOC perspective, one of Dynatrace's standout features is its ability to automatically discover and map application dependencies. This capability simplifies the process of understanding how applications interact with various components within the IT environment, enabling more effective troubleshooting and optimization.
If you're looking at tools like this, we urge teams to remember that Dynatrace primarily focuses on application and compute monitoring, which means it may not cover all aspects of infrastructure monitoring as comprehensively as some other tools. Organizations may need to use it in combination with other monitoring solutions to achieve full-stack visibility. Also, implementing Dynatrace can involve a learning curve, particularly for organizations that are new to application performance monitoring. However, its insights and benefits can significantly outweigh the initial setup and training efforts.
New Relic

New Relic is a client-provided tool that INOC frequently encounters but does not integrate as part of its standard platform. (INOC often works with New Relic as part of a client’s pre-existing suite of monitoring tools rather than as a core component of INOC’s recommended solutions.)
New Relic excels in monitoring web applications and providing actionable insights to improve performance. It tracks critical metrics such as response times, error rates, transaction volumes, and throughput. These insights enable organizations to identify and address performance bottlenecks, ensuring smooth and efficient application operations. The detailed transaction tracing capabilities of New Relic allow for a granular view of application performance, making it easier to pinpoint specific issues within the application stack.
One of New Relic's strengths is its real-time monitoring capabilities. These allow organizations to detect and respond to issues as they occur, minimizing downtime and maintaining high application availability. The real-time data provided by New Relic is crucial for maintaining the performance and reliability of web applications in dynamic and fast-paced environments.
New Relic offers advanced analytics features, including anomaly detection and predictive analysis. These tools help proactively identify potential issues before they impact users. By leveraging machine learning algorithms, New Relic can detect unusual patterns and anomalies in application performance, providing early warnings and enabling preemptive action.
While New Relic offers valuable performance data, integrating it with other tools within INOC’s ecosystem may require additional effort and customization. This is because New Relic operates as a standalone tool with its own data collection and reporting mechanisms. Integrating its insights with other monitoring and management tools can involve significant customization to ensure seamless data flow and correlation. As a client-provided tool, the client typically bears the cost of using New Relic. Organizations need to consider the pricing model of New Relic, which can be based on the number of hosts, the volume of data ingested, or other usage metrics. While it offers robust features, the cost can add up, especially for large-scale deployments.
How INOC integrates with monitoring/observability tools to unlock maximum performance
Regardless of ownership, monitoring tools play a crucial role in interfacing with INOC’s Ops 3.0 Platform by gathering event intelligence and communicating it to the larger INOC ecosystem for performance management and observability. These tools are the primary sources of event data, or "smoke signals," indicating potential IT environment issues.
Get a quick intro to our Ops 3. Platform:

Once integrated into INOC’s platform, these tools provide a continuous stream of data essential for real-time monitoring and long-term performance analysis. The gathered event intelligence is processed and correlated, offering actionable insights that help identify trends, diagnose issues, and optimize resource utilization.
A few key points of our integration here:
- Event Monitoring: These tools continuously monitor various network, IT, and cloud infrastructure elements. They detect anomalies and trigger alerts when predefined thresholds are breached, ensuring that potential issues are flagged promptly.
- Performance Management: These tools help track and analyze KPIs by feeding performance metrics into INOC’s platform. This data is vital for assessing the health and efficiency of the IT environment, enabling proactive management and optimization.
- Unified Observability: Integrating these monitoring tools allows for a unified view of the entire IT stack, from layer one to layer seven. Our supported NOC clients find that this holistic visibility is critical for effective observability, ensuring that all aspects of the infrastructure are monitored and managed cohesively.
- Scalability and Flexibility: INOC’s platform is designed to work with multiple monitoring tools, regardless of the specific products or vendors involved. This flexibility allows organizations to leverage their existing investments in monitoring solutions while benefiting from the INOC ecosystem's advanced capabilities that our clients can simply inherit rather than build themselves.
2. Machine Learning and Automation (AIOps)
AIOps—Artificial Intelligence for IT Operations—combines machine learning (ML) and automation to identify and automate low-risk tasks and unlock the insights contained within massive amounts of data generated across an environment. With vastly superior data processing and machine learning power, the NOC can perform correlation much faster and identify the subtle indicators of approaching issues within a torrent of primarily noisy data.
Here at INOC, we’ve made significant strides in applying AIOps at strategic points in the NOC operational workflow. (Talk to us if you’re interested in learning more about the potential service enhancements achieved by using AIOps for your organization.)
📄 Read our free white paper for the proper deep dive into AIOps and the NOC: The Role of AIOps in Enhancing NOC Support.
While our white paper explains several ways AIOps can be applied in NOC workflows, currently, the most common application is in enhancing the NOC’s ability to correlate data faster and more accurately than humans. In this application, an AIOps tool feeds in events (via API, SNMP, email, or whatever comes out of the NMS) with some initial correlation rules to tie related events together. Over time, ML will recognize patterns and provide feedback, which can then be used to grow further, improve the rule set, and make automated monitoring and ticketing increasingly more effective.
The value here can be massive, especially in enterprise environments where incidents and events must be correlated across three, four, or five different monitoring platforms. A well-tuned AIOps platform can be fed information from all of those platforms and make incredibly effective correlations across them—consolidating all of those feeds from disparate systems and providing remarkable intelligence onto the incident ticket.
Inherit the most powerful AIOps NOC capabilities available today
Rather than wasting time gathering information across a set of siloed and fragmented tools, we’re leading the industry in utilizing (and expanding) a suite of AIOps tools at strategic points in the NOC operational workflow.
By applying AIOps to the NOC operations environment, we’re taking steps to remove the filters required to make analysis manageable for human engineers. With vastly superior data processing and machine learning power, we’re working to make the NOC capable of identifying the subtle indicators of approaching issues within a torrent of noisy data.
For the first time, we’re able to start listening to what all of your data has to say about your environment and using those insights to deliver genuinely proactive NOC support.
Today, we’re already applying these tools to improve event monitoring and management as we continue to expand our service to provide additional value. We're the first, and so far the only, NOC support provider using AIOps to consolidate and process alarm and event data from all sources and help the NOC understand the significance of an alarm or event in the proper context, as well as its possible impact on infrastructure services and application availability.
Here are a few stand-out AIOps capabilities of our platform that translate into immense value for our supported customers and partners:
- Automated Alarm Correlation: Our platform uses machine learning to significantly reduce the time from initial alarm to incident ticket creation. This ensures that tickets are created for every event deserving of one and nothing is missed. Our alarm experts carefully and continually monitor and fine-tune the platform’s machine learning, making us faster and more accurate when identifying issues as we gather more data.
- Incident Automation: Our platform ingests alarms via our AIOps engine and enriches and correlates them with similar alarms to create a single incident ticket. Then, automated workflows assign or attach impacted CIs and differentiate the affected services or CIs from the likely cause of an incident. The system also attaches relevant knowledge articles for incident resolution. This level of incident automation is available on day one of service. Over time, we further automate repeatable tasks within the alarm-to-action guides and runbooks as we collect more actionable information, such as interface and log data.
- Auto-Resolution of Short Duration Incidents: Momentary disruptions can cause incidents that quickly resolve themselves, which can be a useless distraction for NOC engineers. To address this, we've added automation that automatically resolves any ticket that has alarms within a few minutes. This provides faster updates to our supported clients and reduces non-productive work for the NOC, allowing us to focus on critical ongoing issues. For clients utilizing our Problem Management service, all alarms that fall under this category are still reported on and reviewed by our Advanced Technical Services team as part of Problem Management.
- Discrete, Secure Multi-Tenant Architecture: The INOC Ops 3.0 Platform boasts an advanced multi-tenant architecture that provides customized solutions for each client's unique security needs. This architecture ensures the strict isolation of client data and network access, enabling efficient resource usage, swift deployment and updates, and a consistent client experience. Adhering to ISO 27001 standards, our platform offers a security-first approach, ensuring that our clients' data is efficiently managed and securely guarded. Our multi-tenant architecture offers several advantages. First, shared resources and infrastructure make for a more effective use of resources, resulting in cost savings for our clients. Second, updates and new features can be deployed quickly and uniformly across all clients, ensuring everyone benefits from the latest advancements in real time. Third, despite data segregation, the multi-tenant architecture guarantees that all clients receive the same performance, reliability, and user experience.
BigPanda

BigPanda is an industry-leading event correlation platform powered by AIOps. The platform helps enterprises significantly reduce IT noise and detect incidents in real time before they escalate into outages. One of BigPanda’s greatest strengths is its vendor-agnostic nature, which allows it to correlate events from multiple sources, reducing impact assessment and incident resolution time.
Operating more like a service than a product, BigPanda brings unique value-adds and a higher level of support. It boasts a vast library of integrations and can often be implemented quickly thanks to a solid onboarding process and compatibility with many existing monitoring, change, topology, collaboration, and ticketing tools.
BigPanda requires considerably less effort to start processing information than other tools in its class. However, optimizing the platform’s output to be useful in a production environment may involve a more intricate process, particularly for alarm enhancement functions where machine learning needs extensive training to recognize specific patterns and improve decision-making. (This is why most teams looking to bring AIOps into their support workflow simply inherit our capabilities rather than starting from scratch with their own.)
Some years ago, when we set out to identify the AIOps platform best suited for our particular workflow requirements, we ultimately determined that BigPanda was a good fit.
Here’s a quick summary of the drivers of that decision:
- Scalable Pricing: Instead of a large upfront cost, BigPanda’s pricing model is based on the number of clients or devices running through it. This scalable pricing is advantageous as it grows with the business.
- ML as “Recommender” Rather Than “Decider”: BigPanda’s ML capabilities are designed to augment and improve decision-making rather than making decisions independently. Its data analysis helps recognize patterns and make suggestions that human experts can validate, modify, or expand upon, preventing potential errors while delivering valuable insights.
- Integration with ServiceNow’s CMDB: BigPanda’s ability to integrate with ServiceNow's CMDB enhances event intelligence. When an event occurs, BigPanda queries the CMDB to enrich and correlate data, providing accurate impact assessments and priority settings. This integration allows automated processes like runbook association and automated remediation to kick in with high accuracy, significantly streamlining NOC operations.
- Ability to Ingest Additional Metadata: BigPanda can incorporate and analyze additional metadata, further enhancing the correlations built and strengthening the information output from the CMDB.
Moogsoft

Moogsoft is a cloud-native observability solution designed for DevOps professionals and SRE teams. It offers intelligent noise-reduction, alert correlation, and native observability capabilities, including metrics collection and anomaly detection.
Moogsoft delivers out-of-the-box workflows and integrations with notification and alerting tools to help teams resolve incidents faster and deliver continuous assurance for their critical digital services.
When we evaluated Moogsoft as a potential event correlation tool for our own workflow a couple of years ago, it was still an on-premise solution. At that time, we were impressed by its excellent UI. However, its API capabilities offered less than what we needed in our particular use case. Back then, we considered it a tool that an organization would likely run in its data center and configure through that wonderful UI.
At the time of our evaluation, Moogsoft was a tool that was arguably set in an earlier generation. There was less focus on implementation as code and more focus on UI. However, as of the end of 2020, Moogsoft has relaunched its platform—breaking it into microservices with a cloud-native product. The system is undoubtedly much stronger and more capable than it was during our evaluation and deserves to be treated as a contender with BigPanda.
Again, like with any of these tools, while one platform ultimately proved best for our use case and workflow, each organization is unique and should be evaluated for suitability and value within the context of its specific environment.
One important thing to note about AIOps tools
Currently in 2025, no tool can contextualize the event impact for an IT service without additional instrumentation. Also, the ML algorithms that power these tools can’t establish the priority and urgency of a specific event without service context, which is why starting from scratch with such a tool on your own not only means high costs but sometimes quite a bit of lead time to train the system to understand or “learn” patterns and deliver real value.
Here at INOC, we’re already applying these tools to improve event monitoring and management as we continue to expand our service to provide additional value.
Talk to us about turning up support on our NOC to make our AIOps investments work for you.
3. Ticketing
Ticketing systems are core to ITSM in the NOC. They track issues by their urgency, severity, and personnel assignment and create tickets that describe issues so they can be processed and assigned to the appropriate resource. When a person or group assigned to a task can’t complete it, the ticket will move to the next level for correction.
ServiceNow

ServiceNow is a comprehensive enterprise workflow and ITSM platform. It allows your organization to set up and handle proper flows and configurations for incidents, changes, problems, and much more right out of the box. It's an incredibly robust and multifaceted ITSM tool—the “gold standard” as far as ticketing systems are concerned.
Because it’s the gold standard, it’s an expensive toolset to purchase and implement. It’s also, as we’ve seen firsthand, quite “generic.” Customizing and optimizing the workflows to meet your organization's specific needs takes time and energy. Like some of the other tools we’ve mentioned here, ServiceNow has a wide array of powerful capabilities, but it doesn’t dictate those workflows. You have to build out the service catalog and each of the various workflows.
Once the system has been fine-tuned, however, the sky’s the limit in terms of powerful configurations. For example, your organization can integrate an AIOps tool to feed in the incidents for a whole new level of workflow efficiency.
Another capability is adding intelligence that auto-attaches configuration items that are impacted from your CMDB. It’s even possible to trigger scripts from ServiceNow to log into and collect data from your equipment or infrastructure and include it in the ticket. In this use case, ServiceNow (integrated with the appropriate pre-incident tools) can retrieve and present so much useful information that it can actually isolate an incident before a NOC engineer lays eyes on the ticket. The efficiency opportunities here can’t be overstated.
Jira
Jira differentiates itself from ServiceNow and other ITSM/ticketing platforms because it does have quite a few robust workflows built into it. Also, it’s less “expansive” than ServiceNow. Instead of offering a platform on which many different organizations can do many different things, Jira’s capabilities are more focused on allowing developers to track and manage activities throughout the development lifecycle.
It’s pointed first and foremost at partially or fully cloud-based enterprises, especially those that have adopted a DevOps model. Jira offers both on-premise and cloud-based solutions, which makes it pretty versatile.
Jira can fall down when too much is asked of it beyond the scope of a development team. If you need to control NOC incident workflow, for example, or if you need to customize communications to clients and their customers, you may be stretching Jira beyond its capability if you don’t have the operational intelligence you need to get Jira working well beyond its main focus.
We realize this is a big frustration for many organizations whose DevOps teams otherwise love Jira. That's why we routinely fill that operational gap by integrating Jira into our NOC platform. This way, teams can keep the DevOps models they know and love for developing, deploying, and changing code while gaining the intelligence to work with incidents.
ConnectWise

ConnectWise offers a suite of products that can be purchased together as a complete ITSM solution or as targeted solutions based on the need, such as NMS or recovery. When used as a suite of tools for the NOC, ConnectWise offers valuable value-adds, namely, an AIOps capability positioned between the NMS and the ITSM product to enhance correlation.
While ConnectWise has some limitations to its monitoring capabilities and may not be ideal for every monitoring environment, it’s quite robust from a ticketing perspective. Like the value-adds that come with tying, say, Microsoft products together in a single environment, ConnectWise has found its niche among organizations that find value in its ability to tie its various tools together and become a ConnectWise “shop.”
Also, like ServiceNow, ConnectWise offers the ability to provide customer or end-user portals, which is particularly useful for organizations looking to provide visibility to other stakeholders.
FreshWorks

FreshWorks is primarily used in help desk and desktop support environments. It offers some asset management capabilities but does not qualify as a comprehensive ITSM tool. FreshWorks is well-suited for managing end-user-related issues, such as password resets and access problems, making it a popular choice in enterprise environments where help desk functions are critical.
The tool is specifically designed for help desk operations, efficiently addressing common end-user issues. Its intuitive interface and user-friendly features enable support teams to resolve incidents quickly, ensuring minimal disruption to the end users. It supports various communication channels, including email, chat, and phone, allowing help desk agents to interact with users through their preferred medium.
FreshWorks also excels in ticket management, offering ticket creation, assignment, prioritization, and tracking functionalities. It can automate a few key routine tasks, enabling help desk agents to focus on more complex issues. The system also supports SLAs to ensure timely ticket resolution.
A nice feature of FreshWorks is its self-service portal where users can find solutions to common problems through a knowledge base or community forums. We find this can reduce the volume of tickets and empower users to resolve issues on their own, increasing overall efficiency.
FreshWorks includes basic asset management functionalities so teams can track and manage their IT assets. However, it lacks the depth and complexity of a full-fledged CMDB. This means that while it can handle simple asset tracking and management tasks, it may not be suitable for organizations requiring comprehensive asset management capabilities.
Similar to other ticketing platforms, FreshWorks integrates with various other systems and tools. It offers pre-built integrations with popular applications like Slack, Microsoft Teams, and CRM systems, enabling seamless data flow and collaboration across different platforms. However, its primary role remains in help desk support rather than broader ITSM functions. If you're seeking extensive ITSM capabilities, you might need to integrate FreshWorks with more specialized tools or consider alternative platforms that offer comprehensive ITSM solutions.
FreshWorks also provides customization options to tailor the platform. Users can create custom fields, workflows, and automation rules to streamline their support processes. Additionally, FreshWorks is scalable, making it suitable for organizations of various sizes, from small businesses to large enterprises. FreshWorks is known for its modern and intuitive user interface, which enhances the overall user experience for both help desk agents and end-users. The platform’s ease of use reduces the learning curve, enabling support teams to quickly adopt and utilize its features effectively.
Lastly, FreshWorks offers competitive pricing, making it an attractive option for organizations seeking an affordable help desk solution. Its pricing model is typically based on the number of agents and the features required, allowing organizations to choose a plan that fits their budget and needs.
BMC Helix ITSM (formerly Remedy ITSM)

BMC Helix ITSM is a robust ITSM platform predominantly used in the carrier space. Thanks to its comprehensive incident, problem, and change management capabilities, it has been a staple for many large organizations. However, there has been a noticeable shift towards other platforms like ServiceNow, driven by the need for more modern and flexible ITSM solutions.
This platform is still widely used in the telecommunications sector to manage complex IT operations. Its ability to handle large-scale, intricate IT environments makes it a preferred choice for carriers and service providers. The platform’s strength lies in its scalability and capacity to manage the high volume of transactions and interactions typical in the telecommunications industry.
Helix offers extensive ITSM functionalities, including incident, problem, and change management. These capabilities ensure that organizations can efficiently manage and resolve IT issues, track the root causes of problems, and implement changes systematically. Remedy also supports other ITSM processes, such as service request management, asset management, and service level management, providing a holistic approach to IT service management.
Again, while BMC remains a powerful and widely used platform, some organizations consider it a legacy system. Many are transitioning to newer platforms like ServiceNow, which offer enhanced flexibility, modern user interfaces, and advanced capabilities. ServiceNow, for example, provides more intuitive workflows, better integration options, and a more user-friendly experience, which can reduce the complexity and improve the efficiency of IT operations.
Helix ITSM now offers a cloud implementation, enhancing its relevance in modern IT environments. This cloud version allows organizations to leverage the benefits of cloud computing, such as scalability, reduced infrastructure costs, and improved accessibility. The cloud implementation also supports hybrid environments, enabling organizations to seamlessly integrate their on-premise systems with cloud-based services.
It's also highly customizable, offering a range of configuration options and supporting the development of custom applications and workflows. This flexibility is particularly valuable for large organizations with unique requirements and complex IT environments. Implementing and maintaining BMC Helix can be costly, particularly for smaller organizations. The shift towards more cost-effective and scalable solutions like ServiceNow is partly due to the high total cost of ownership associated with Remedy, including licensing, infrastructure, and maintenance expenses.
4. Reporting
Reporting has two primary functions in the NOC. One is to understand how the NOC operates to better manage its components (tools, staff, and processes) for day-to-day operations and to understand mid- to long-term planning trends. The second is to identify patterns that point to chronic issues so teams can manage long-term problems to fix them.
Two important components have to be in place to make reporting robust enough to achieve both of these goals well. One is the backend, which consists of the data lake and the data warehouse. The front end must consist of visualization and data exploration components.
Power BI and Tableau

Power BI is a Microsoft reporting product that everybody loves because it's free and quite powerful. And then there's Tableau, which is decidedly not free, but somewhat more powerful. They’re both cloud-based as well as on-premise solutions. But both of them are fundamentally business intelligence tools that allow you to build dashboards and visualizations to help you understand data. They can take complex data and allow you to analyze and present them in a simple, digestible way.
In the NOC, these tools help teams understand, for example, how much time is being spent handling issues, how many tickets are being generated over time, or more granularly, how individual engineers are performing.
Snowflake and AWS Redshift

Snowflake is a cloud-based data warehouse, and Redshift is a service within AWS. These tools serve as data stores optimized to deliver data into front-end platforms like those we mentioned above. They can be used as data lakes (for storing raw data) or data warehouses (for storing processed data that have been normalized to a common format so that frontend tools can easily consume it).
An ETL tool is used between the data lake and data warehouse to pull in and transform the data into a normalized format. This enables your organization to do simple reporting projects like generating graphs and much more sophisticated reporting such as using machine learning against the data to discern patterns and trends.
This level of reporting enables a NOC to mature its operation by examining itself in extreme detail. What precisely is taking up most of an engineer’s time? How can that task be re-examined or re-tooled to be more efficient? What root causes can we address through problem management?
It’s important to note that, as we’ve seen many times over, IT organizations can face a huge upfront investment in normalizing disparate data sources to be able to report across them. However, once that hurdle has been cleared, the reporting opportunities deliver a consistent value far exceeding that upfront cost.
Here at INOC, we first help organizations make that hurdle as small as possible by drawing on years of experience to make normalization as streamlined as possible and then present a wealth of established reports, dashboards, and visualizations to start getting value immediately.
5. Communication and Escalation
Effective communication and escalation are crucial in NOCs to ensure timely and efficient incident management. The following tools are integral to enhancing these processes within the NOC environment.
We've provided more rapid-fire takes on each.
- Microsoft Teams: Teams can be integrated for seamless communication within the NOC, allowing real-time collaboration and information sharing. It supports chat, video conferencing, and file sharing, making it a versatile tool for daily operations. Teams serves as a primary communication tool, facilitating quick decision-making and coordination among team members. Its robust feature set, including channels, tabs, and third-party app integrations, enhances team productivity and collaboration.
- PagerDuty: PagerDuty manages alarms and notifications. It excels at handling on-call schedules and escalation processes, ensuring that the right personnel are notified of critical incidents. Its intelligent alerting system helps reduce noise and focus on the most critical issues. While effective for short-term solutions, PagerDuty can become unmanageable with extensive rule sets. As the complexity of incidents and alerting requirements grows, organizations may need to transition to more scalable solutions like INOC’s platform, which can offer more comprehensive incident management capabilities.
- Slack: Similar to Teams, Slack is used for communication and collaboration within the NOC. It supports channel-based messaging, direct messages, and integrations with various monitoring and ticketing tools, providing a centralized platform for team communication. Slack’s integration capabilities enhance its utility in incident management and response. It can be connected to various applications and services, enabling automated workflows and real-time updates directly within the Slack environment.
- Twilio: Twilio is used for sending SMS notifications and alerts, ensuring that critical issues are communicated promptly to the relevant stakeholders. Its global reach and reliability make it an excellent choice for urgent and high-priority communications. Twilio offers flexibility in setting up notification rules and integrating with other communication platforms. Organizations can tailor the notification system to meet their specific needs, ensuring that the right information reaches the right people at the right time.
A few insights from the NOC
These tools collectively enhance communication and escalation processes within the NOC. Providing multiple channels for interaction and integration with other systems ensures that team members are always informed and able to respond quickly to incidents.
Tools like PagerDuty are excellent for managing on-call rotations and immediate notifications but may require integration with broader platforms for comprehensive incident management. Microsoft Teams and Slack facilitate real-time communication and collaboration, while Twilio ensures reliable and customizable notifications. Together, these tools create a robust communication framework that supports efficient and effective NOC operations.
Zooming Out: Properly Operationalizing Tools Through Strategic NOC Outsourcing
Outsourcing NOC support to an operationally mature NOC services provider offers a number of advantages over building out a NOC in-house. It often lowers both up-front and ongoing costs. It enables organizations to utilize their own IT resources better. It makes it incredibly easy to scale up and down to reflect changes in the business.
Outsourcing NOC service to a highly capable support provider is also attractive from a tools perspective. Take the NMS, for example. The high cost of purchasing and integrating a monitoring and management solution only increases when multiple disparate monitoring and management systems sow confusion, create tension between teams, and steal valuable time from revenue-generating projects.
This problem is extremely common among enterprises and communications service providers—and it's one that strategic NOC outsourcing is perfectly suited to solve. Rather than replacing otherwise well-functioning monitoring systems, an expert outsourced NOC service provider can simply fill the operational gap between them, enhance the insights that flow out of them, and standardize everything through a “single pane of glass.”
Here are a few of our own capabilities as an outsourced NOC support partner that have proven to be massive value-adds for organizations struggling to make their tools work for them rather than the other way around:
- Alarming interface integrations: When monitoring tools are already in place, we integrate downstream of an NMS, EMS, and/or devices through an alarming interface—the mechanism by which your systems tell ours that an event has occurred.
- Event correlation and ticketing integrations: Once we’ve received an alarm, we employ both human and automated ticket correlation processes to create appropriate incident tickets, problem tickets, and other records, which can be synchronized to the ticketing system for troubleshooting and resolution.
- CMDB integrations: A seamless CMDB integration ensures our configurations match perfectly. CMDB integration associates the appropriate meta information for each alarm we receive and each subsequent ticket we create, arming the NOC engineer with the actionable information they need to make informed decisions. When necessary, we also draw on years of experience to enhance existing CMDB structures and capabilities, further enhancing efficiency and effectiveness.
Final Thoughts and Next Steps
We realize organizations make significant investments in their IT infrastructures and the tools they use to support them, which is why we built our outsourced NOC support services to be highly capable, highly flexible, and highly integrable. No matter what tools you’re currently using or where your operational gaps lie, we take the time to discover exactly where technology or intelligence is needed to make your service work better and tailor a support solution to fit.
When it comes to NOC tools specifically, we help IT organizations save time and money that would otherwise need to be spent configuring tools, integrating them with other systems, developing processes and procedures around them, and training staff to use them effectively. By feeding the right intelligence into your operational model, the end result is almost always the same: increased accuracy, increased productivity, higher success rate for resolution, and ultimately, reduced cost of operations.
Need to take your existing support infrastructure to the next level with an outsourced NOC solution? Schedule a NOC consultation with our Solution Engineers and start the conversation. Want to learn more about applying advanced tools to the NOC? Grab our free white paper below and learn how much you stand to gain from adding AIOps to your support workflows.
Free white paper The Role of AIOps in Enhancing NOC Support
Download our free white paper and learn how your NOC support stands to gain from AIOps by overcoming operational challenges and delivering outstanding service. Use the free included worksheet to contextualize the value of AIOps for your organization.


